Front-end: Navigating DraCor#
Warning
This chapter is a draft. It has not yet been proofread or formally reviewed.
Content, terminology, and examples may change.
Chapter metadata
Author: Antonio Rojas Castro
Version: 0.4 (2026-02-10)
Review status: Not yet reviewed
Planned reviewers: DraCorOS editorial team
Note
How to use this chapter: We work entirely in the DraCor web interface. We begin on the home page, move to a corpus page, and then explain each play tab (Network, Speech distribution, Full text, Downloads, Tools). Our goal is to make exploratory browsing precise enough that others can reproduce what we saw.
1. Overview#
The DraCor front-end is the most accessible entry point to DraCor’s drama corpora. It supports three key activities: discovering corpora and getting a quick statistical overview (home page), browsing a corpus and selecting plays (corpus page), and inspecting a play through a set of tabs that expose text layers and derived analytical views (play page tabs).
In this chapter we focus on what each view is for, what it shows, and what we can infer safely. We treat the interface as a structured reading environment: a way to move from a research question to observations grounded in what is visible and can be downloaded.
2. Pre-requisites#
Web browser and internet access.
Basic familiarity with plays (characters, acts/scenes) is helpful.
No programming experience required.
3. Learning Outcomes#
After completing this chapter, learners will be able to:
Use the DraCor home page to select a corpus and interpret the corpus summary cards.
Navigate a corpus page, search and filter the play list, and identify stable play identifiers.
Explain what each play tab (Network, Speech distribution, Full text, Downloads, Tools) is intended to show.
Interpret the Network and Speech distribution tabs at an introductory level.
Use Full text to contextualise insights from analytical tabs and to check sources and segmentation.
Use the Downloads tab to retrieve outputs linked to specific semantic layers of a play.
4. Theoretical Background#
DraCor presents drama as structured data. The front-end does not simply display a text: it renders several layers that are either encoded (for example, the full text in TEI format) or derived (for example, co-occurrence networks). This matters for interpretation. Each tab corresponds to a specific representation, and the visualisations we see depend on modelling assumptions. In particular, the Network tab describes a co-occurrence rule: characters are linked if they appear in the same scene or act (segment). For this reason, the front-end is best used as a exploratory environment: we can quickly form hypotheses, but we should make our observations traceable by noting which corpus and play we inspected, and which tab produced a given view.
Tip for learners
When you write down an observation, include the corpus and play ID (from the URL or header) and the tab you used. If the tab offers selectable methods or layers, note the selected option as well.
5. Practical Examples#
Example 1. Starting from the home page (selecting a corpus)#
On the DraCor home page we see corpus cards (for example, FreDraCor, GerDraCor, EngDraCor, RusDraCor) that summarise each corpus at a glance. The cards combine a quick sense of scale (how many plays and characters a corpus contains) with token counts for different textual layers. These layer-specific counts are a useful reminder that drama is represented in multiple dimensions: running text, spoken text (sp), and stage directions (stage) can behave differently across corpora, depending on editorial practice and encoding. The cards also display a “last update” timestamp and a commit reference, which helps situate the corpus as a living dataset.
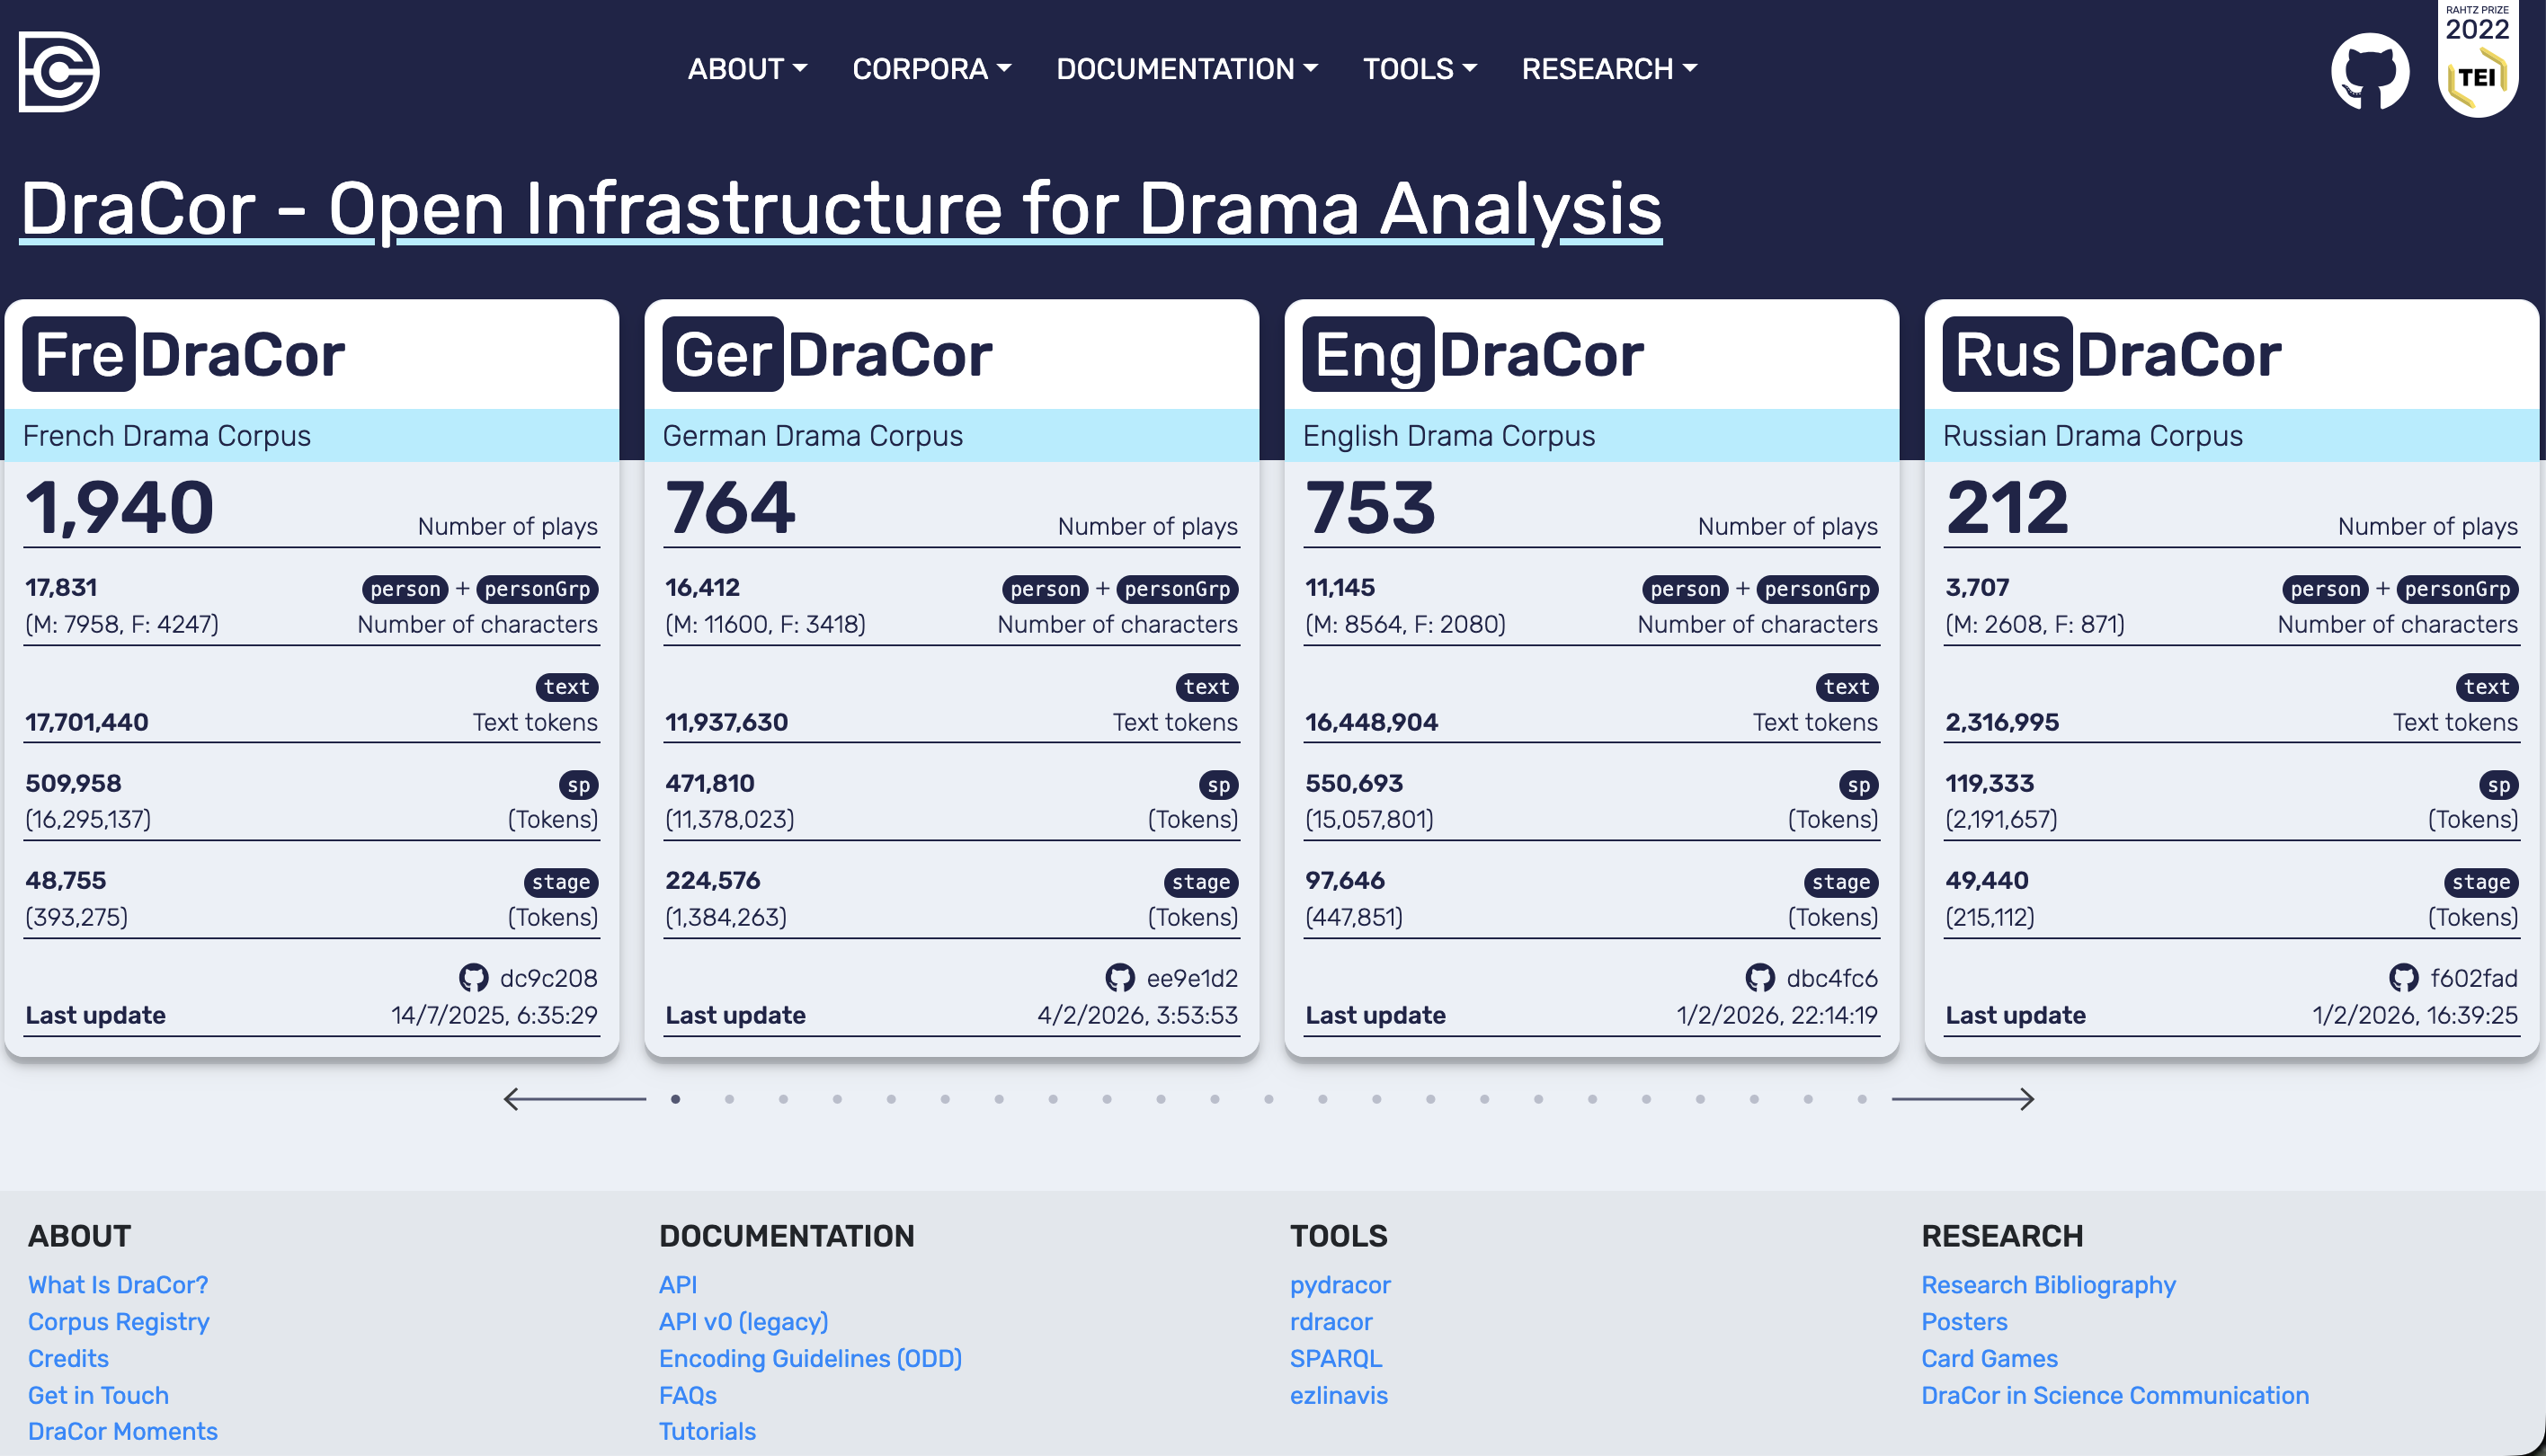
DraCor home page. Corpus cards provide a high-level overview (plays, characters, token counts for text/sp/stage, and a last update indicator).
Example 2. The corpus page (searching and selecting a play)#
A corpus page (example: CalDraCor) presents a searchable play table. Alongside editorial credits and a commit reference, the interface typically offers corpus-level metadata downloads (for example, JSON and CSV). The play table itself is the most practical entry point for reproducible selection: it lets us search, sort, and identify each play by a stable play ID. When we move from browsing to documentation (for teaching, for collaboration, or for later analysis), the play ID is more reliable than a title alone, especially across corpora with variant spellings or multiple versions.
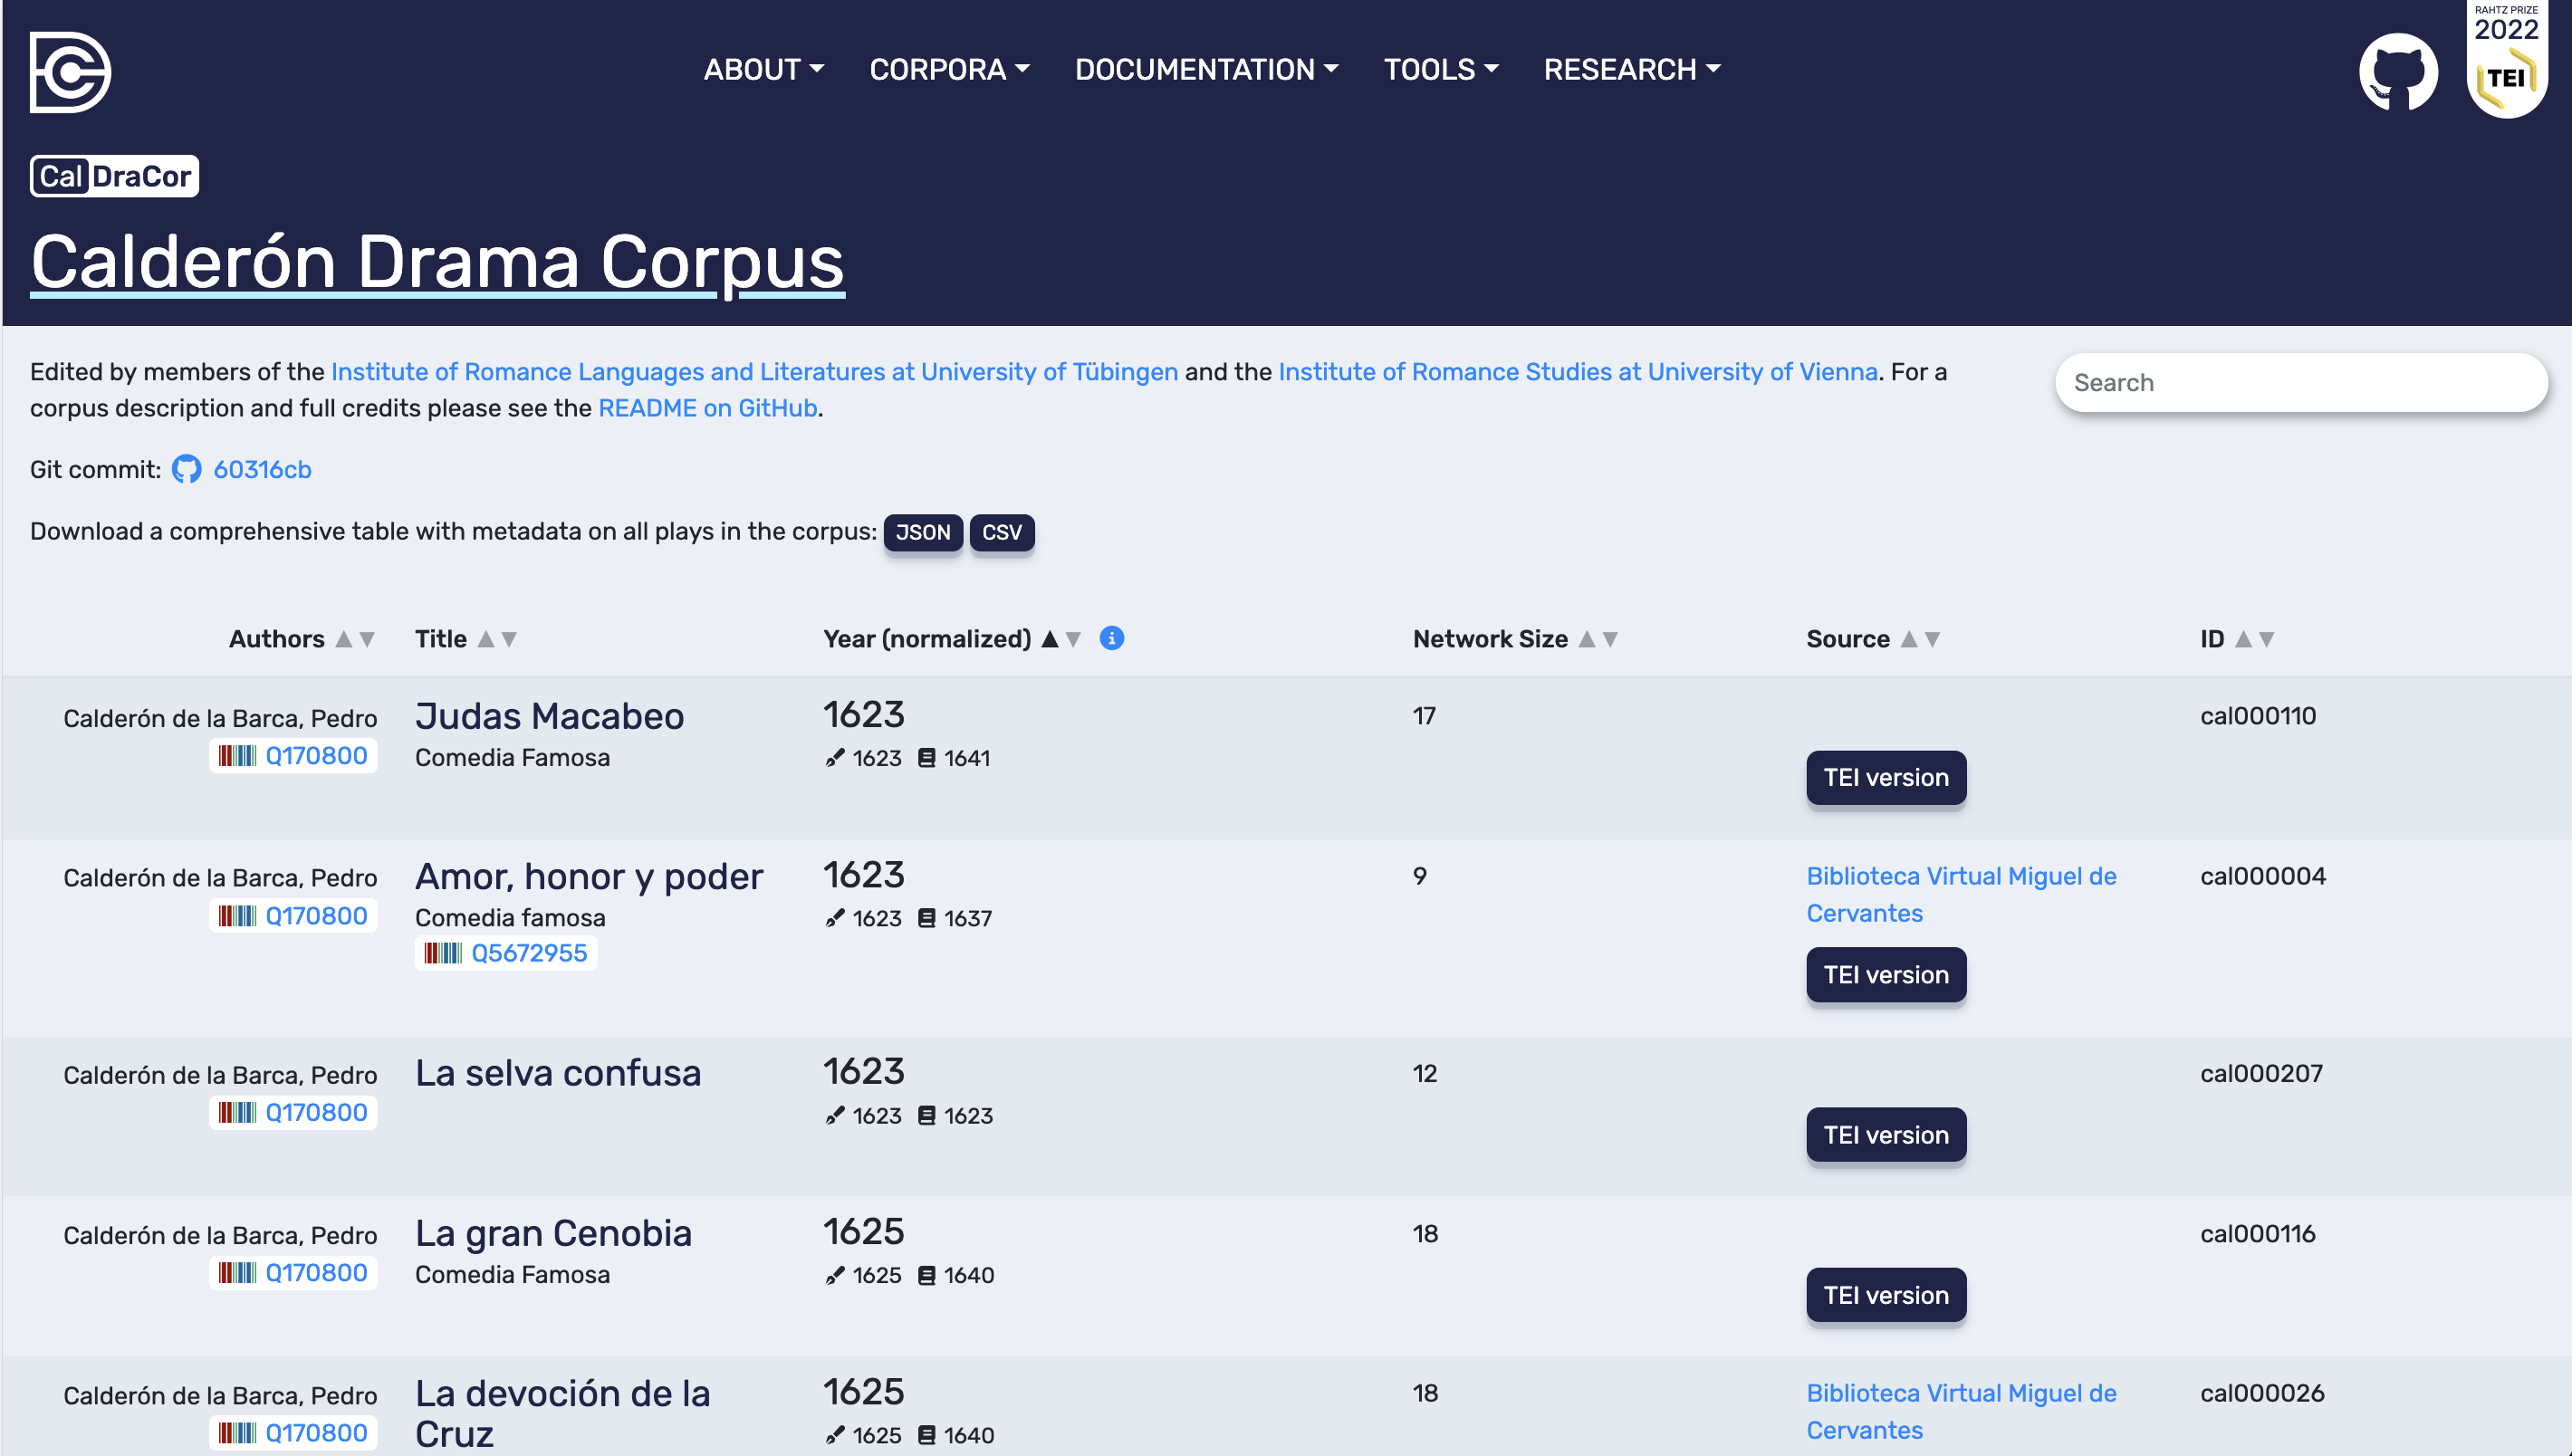
CalDraCor corpus page. The play table can be searched and sorted; corpus-level metadata can be downloaded as JSON or CSV; each play has a stable ID.
Example 3. The play page (header and tabs)#
Play pages share a consistent header layout. In the example used in this chapter (“La vida es sueño”), the header shows the play title, the corpus badge (CalDraCor), a play ID, and external identifiers such as Wikidata QIDs for the play and author. These identifiers matter because they support unambiguous reference and interlinking across systems. Below the header, the play-level navigation tabs are visible: Network, Speech distribution, Full text, Downloads, and Tools. In the rest of this chapter we explain these five tabs in the same order.
Tab 1. Network#
The Network tab provides a co-occurrence network for the play. The interface states the modelling rule explicitly: if characters appear in the same scene or act (segment), they are linked. What we see first is a graph visualisation, which serves as an immediate “visual catch”. This image is not only illustrative; it is also a reminder that the network is a specific representation of interaction derived from segmentation choices.
Next to the graph, DraCor summarises network properties in a compact panel. These values help us describe the network beyond what the eye can capture:
Segments: the number of segments used to derive co-occurrence links (the unit behind “same scene/act (segment)”).
All-in at segment n (at x% ): the point in the play where the network has accumulated x% of its nodes, indicating how quickly the cast becomes present in the segmentation.
Network size: the number of speaking characters/entities in the play.
Density: a value between 0 and 1 indicating how many of all possible connections between nodes are realised.
Diameter: the highest value among all shortest distances between two nodes.
Average path length: the average of all shortest path lengths between pairs of nodes in a connected network.
Average clustering coefficient: a value between 0 and 1 indicating how strongly the network tends to form connected triplets (“triangles”).
Average degree: the mean number of direct connections per node.
Maximum degree: the highest number of direct connections held by any single node (often shown with the character’s name).
The Network tab usually also includes a character list in order of appearance, sometimes with icons indicating sex and group characters (personGrp). This list provides a useful bridge to the text views: it invites us to check where and how a character enters the play and whether structural prominence in the network corresponds to frequent co-presence in the segmented text.
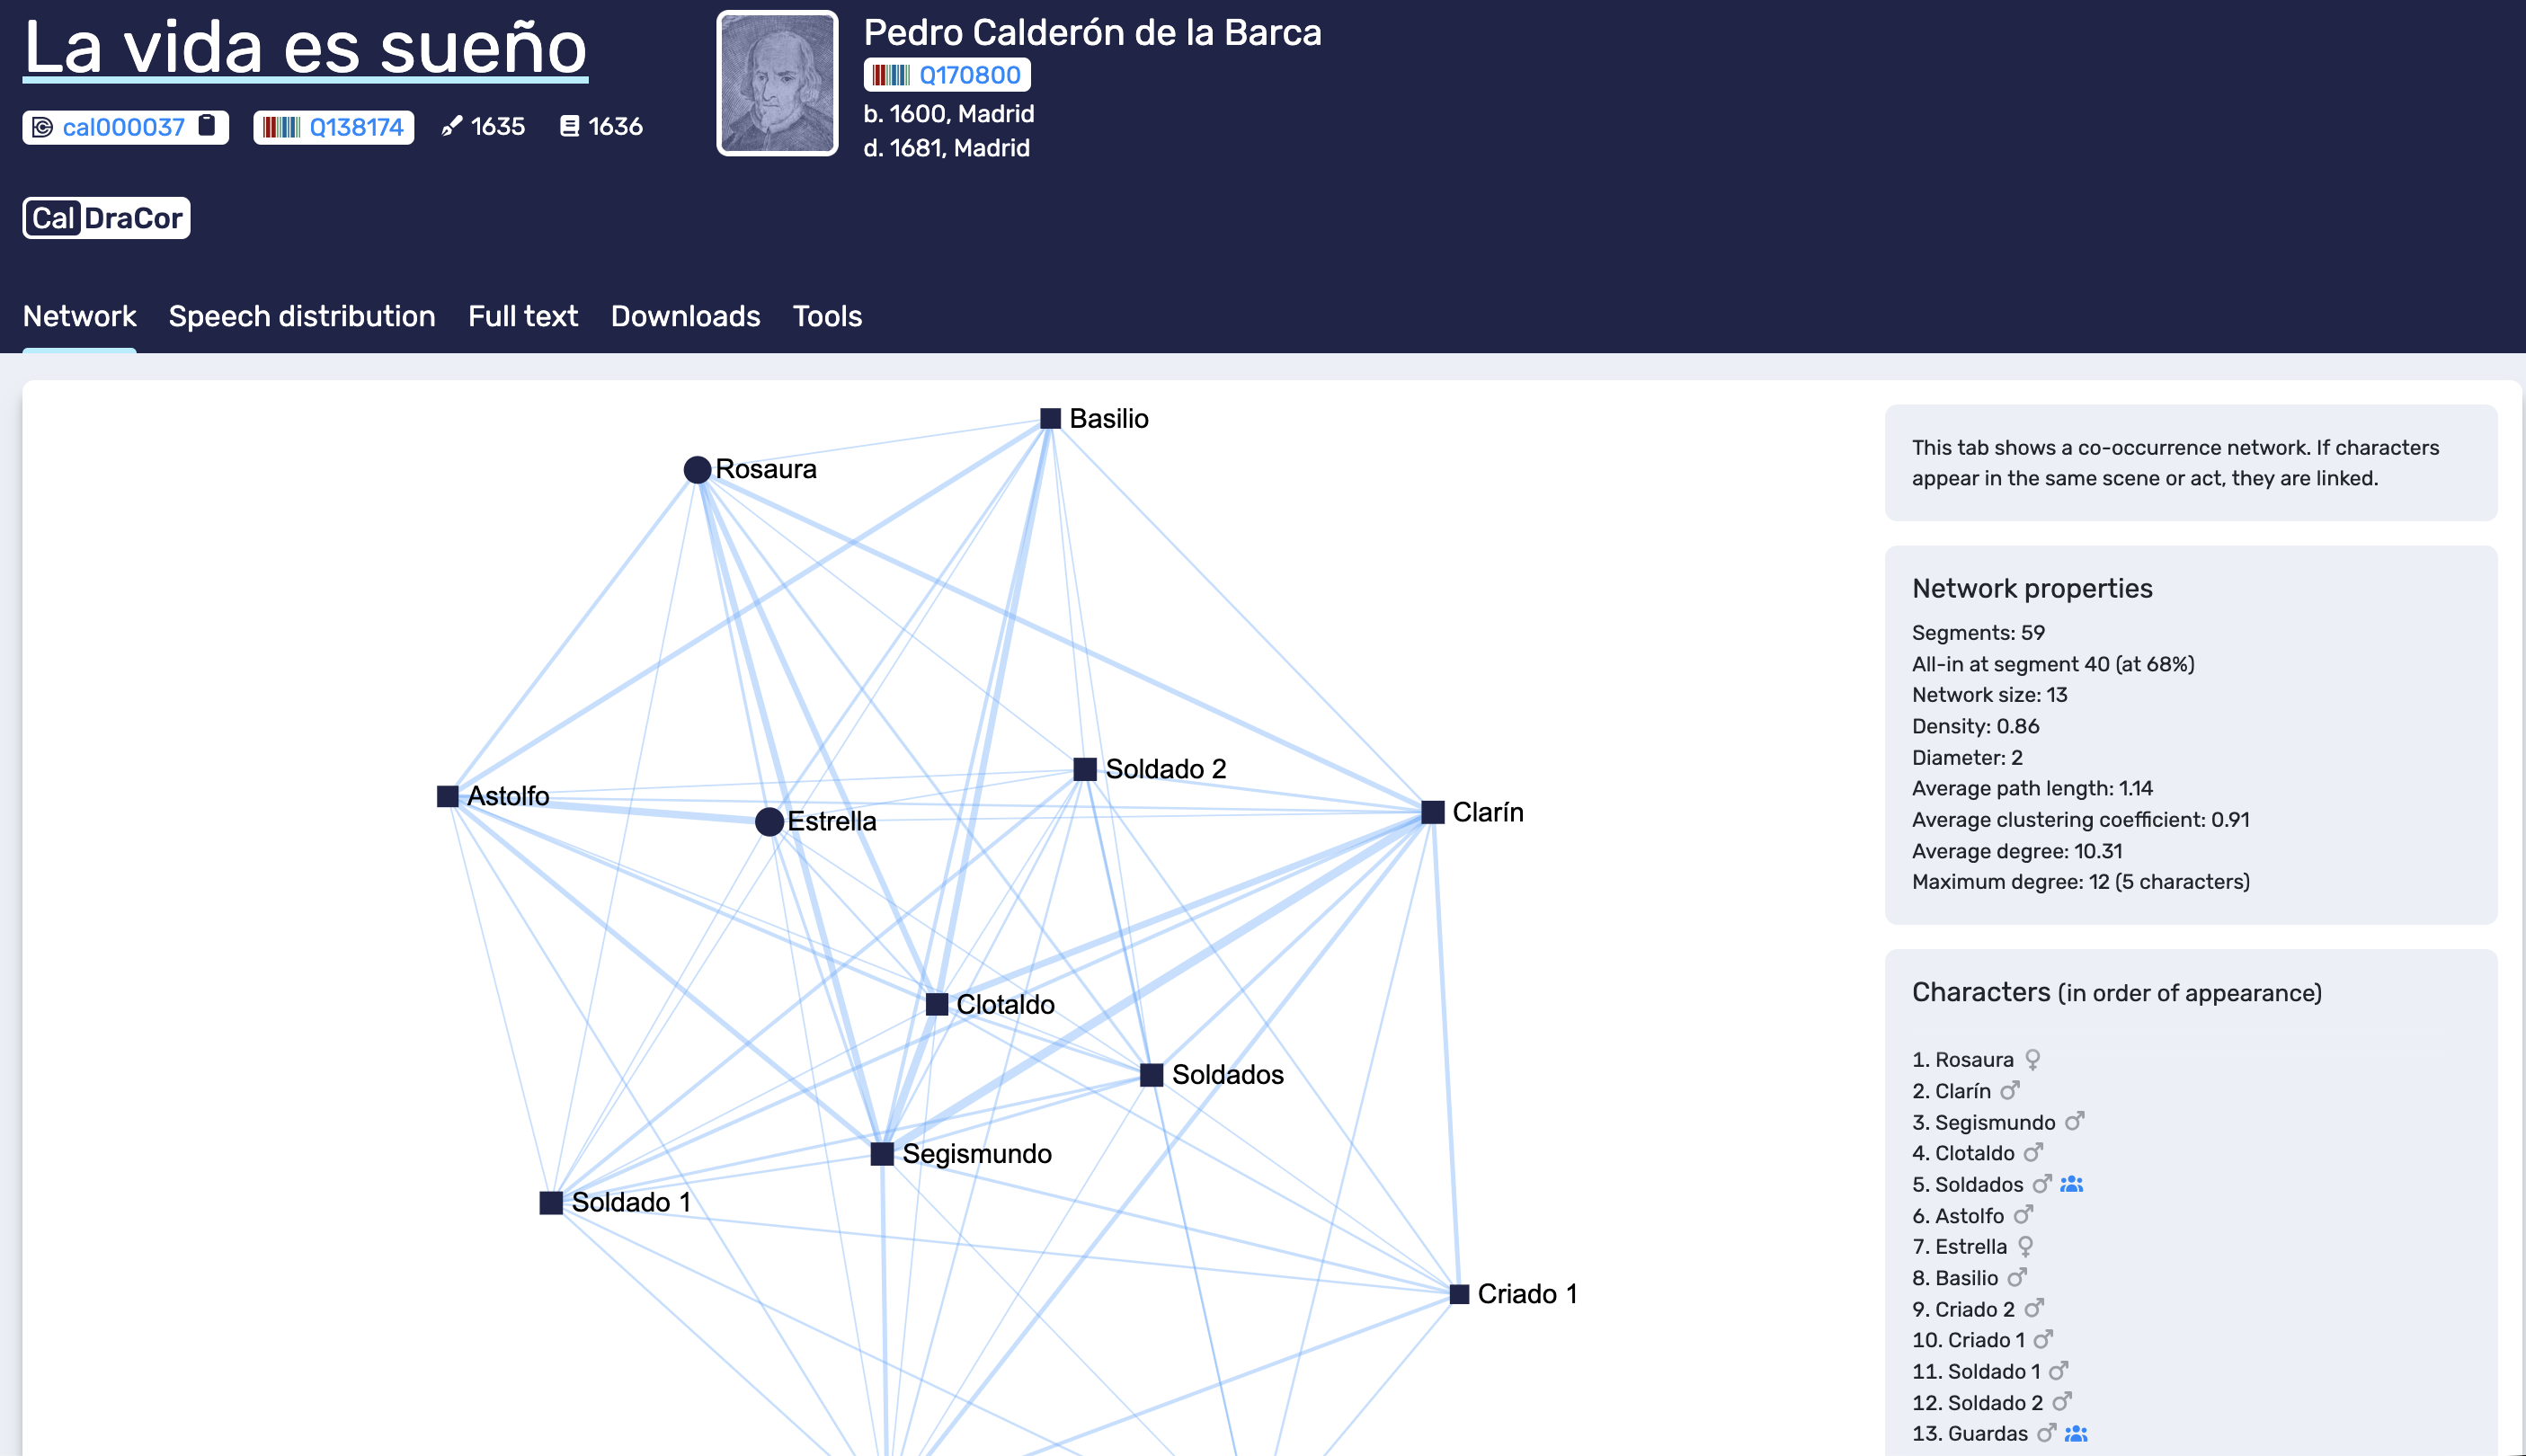
Network tab. DraCor shows a co-occurrence network and summarises network properties (including the number of segments used to derive co-occurrence).
Tab 2. Speech distribution#
The Speech distribution tab visualises how speech is distributed across the play. In the example shown, the interface offers multiple methods, selectable via radio buttons (for example, Sapogov 1974, Yarkho 1997/2019, Trilcke/Fischer et al. 2017). This is a useful design choice because it makes clear that “speech distribution” is not a single universal measure but an operationalisation.
The plot shown in this view uses scene (segment) number on the x-axis and number of characters on the y-axis. Two curves are displayed: one includes all characters, and one restricts the calculation to non-group characters only. Comparing these curves gives a quick sense of how collective roles affect the apparent distribution and how “crowded” different parts of the play are. When we interpret this tab, it is worth keeping track of the selected method, because switching methods can change what the graph emphasises and therefore what comparisons are meaningful.
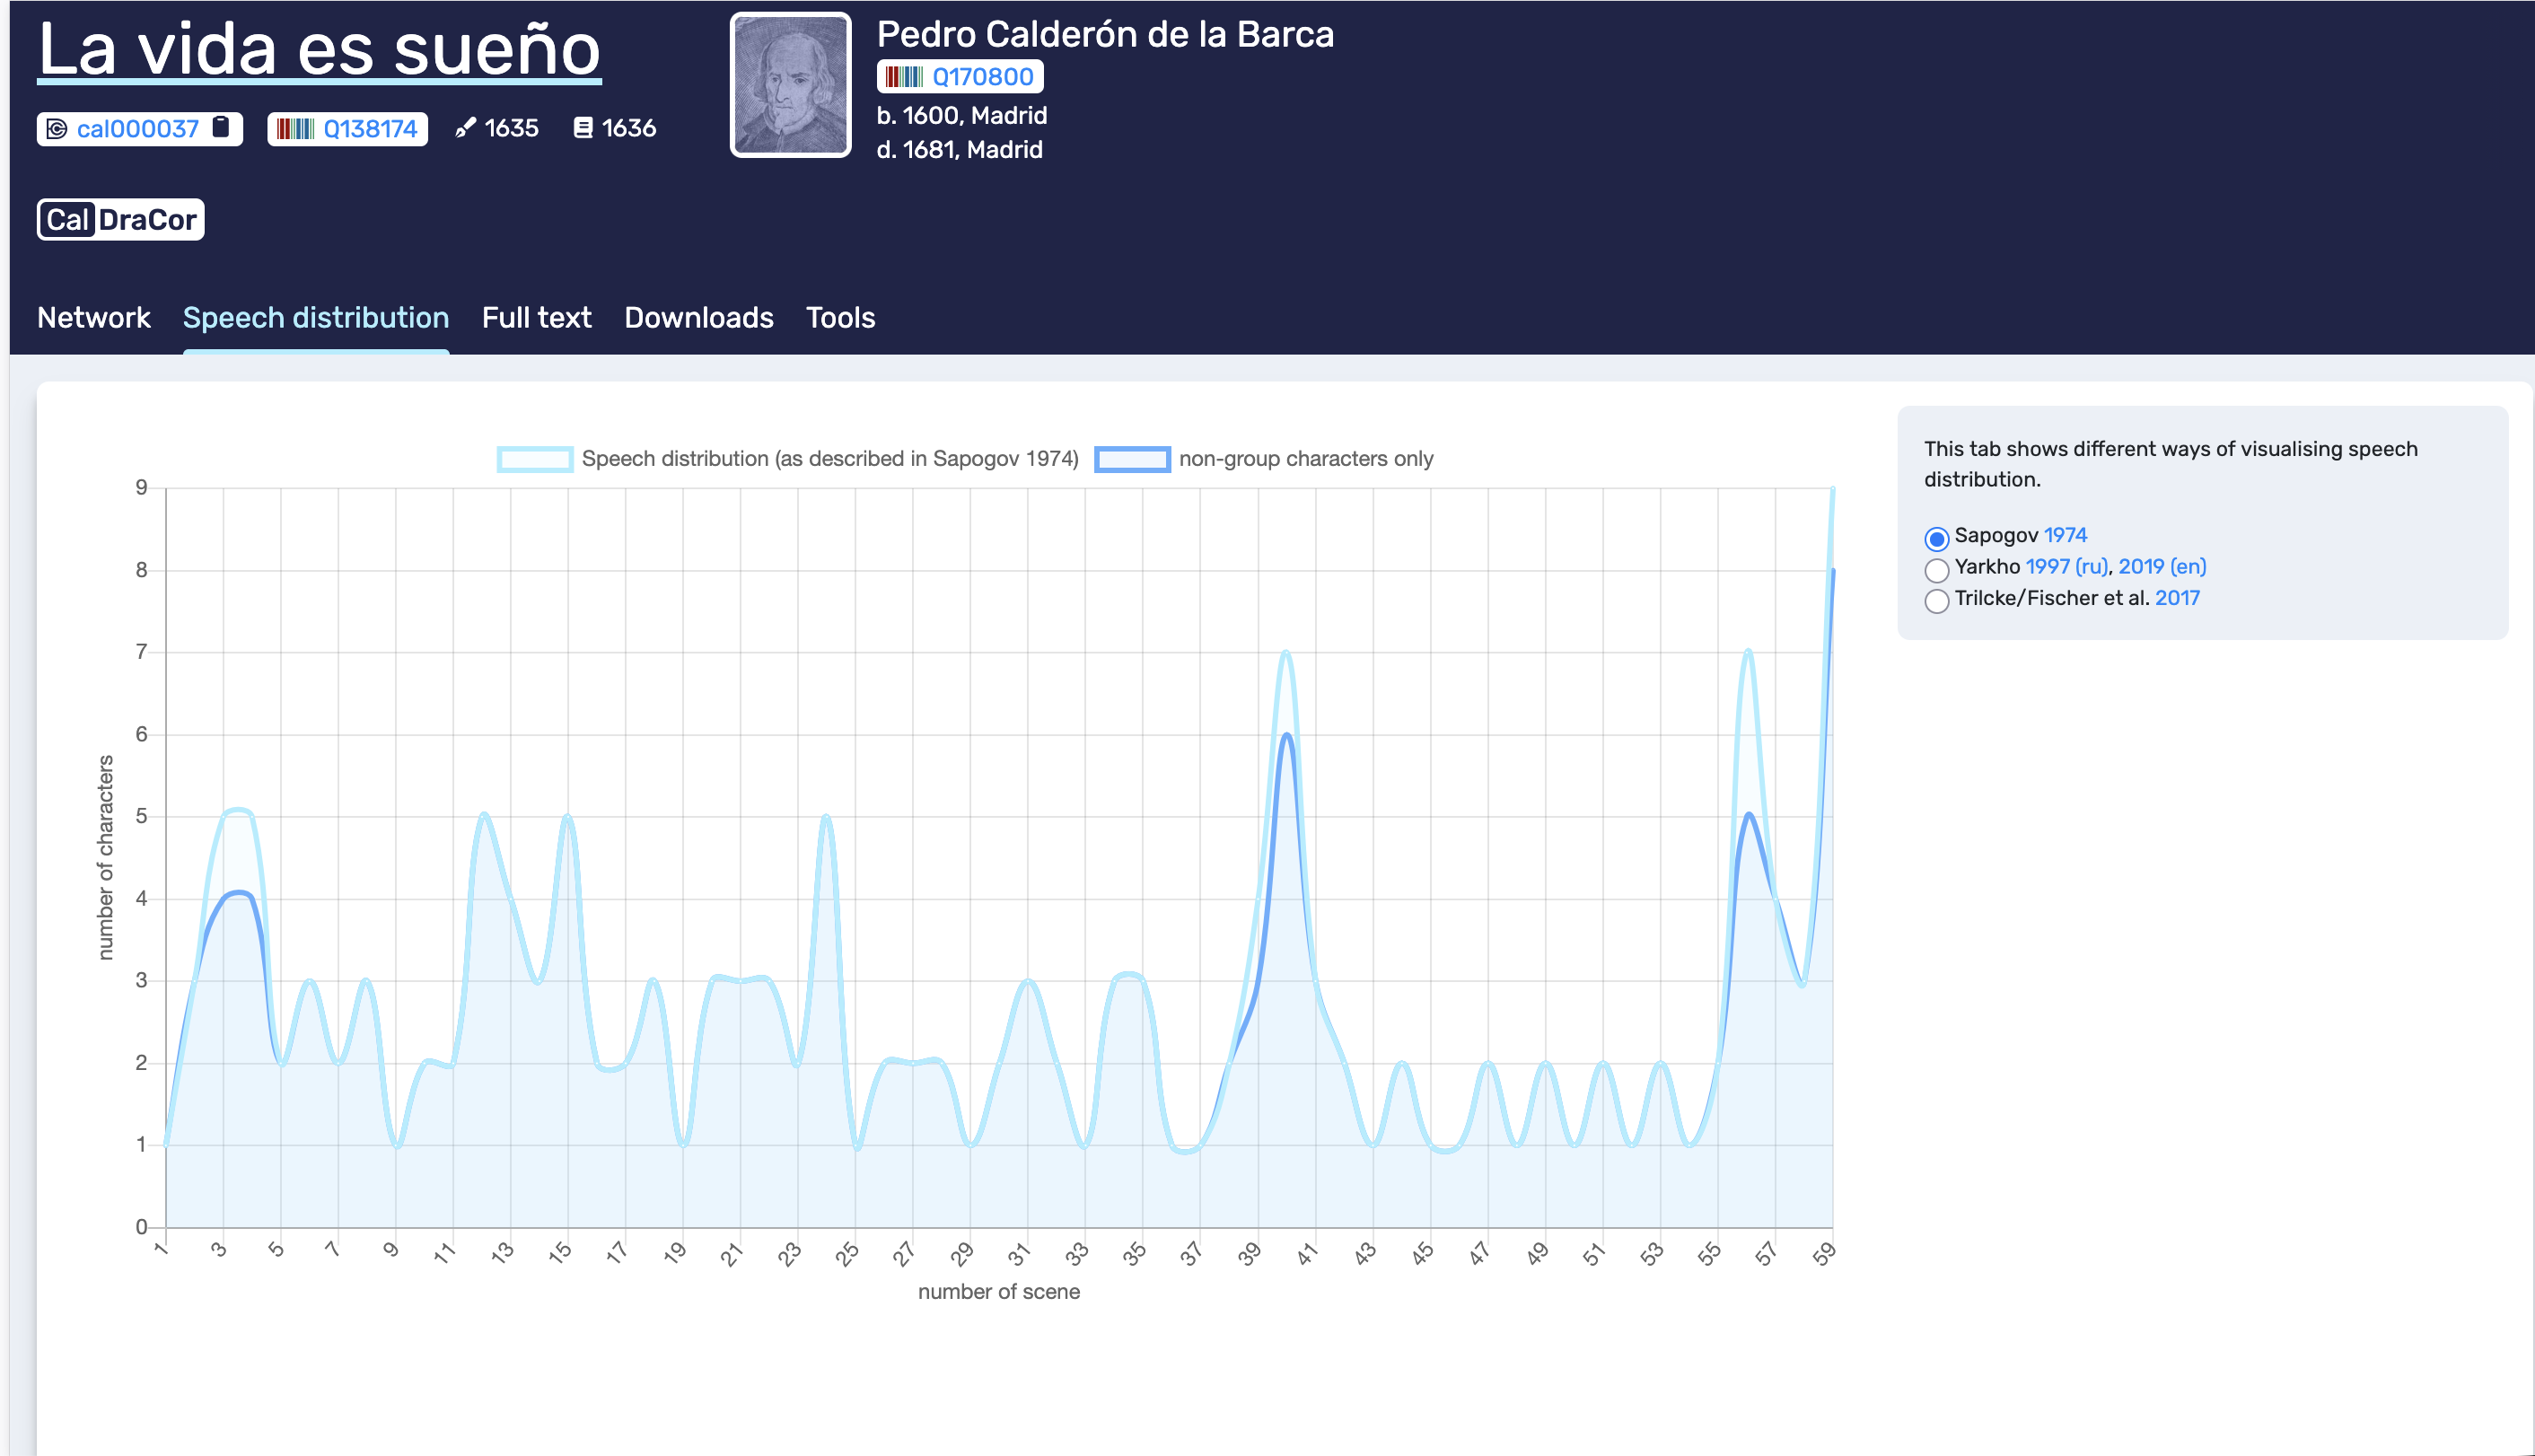
Speech distribution tab. The interface offers different operationalisations (selectable methods) and can distinguish group characters from non-group characters.
Tab 3. Full text#
The Full text tab provides a readable play text with navigation support, and it is also where provenance is made visible. In the example, the text is presented with structural markers (for example, Jornada I), with stage directions and speakers, and accompanied by a source note indicating where the text was obtained from and how it was adapted.
A key feature of this tab is the Segments panel. It lists segments and shows which characters are present in each segment. This panel serves both as navigation and as an explicit representation of the segmentation that underlies other views, especially the co-occurrence network. For interpretive work, Full text is therefore the tab we return to when we want to contextualise a pattern observed elsewhere: peaks in speech distribution or unexpectedly central characters in the network become more meaningful when we can locate the relevant passages quickly.
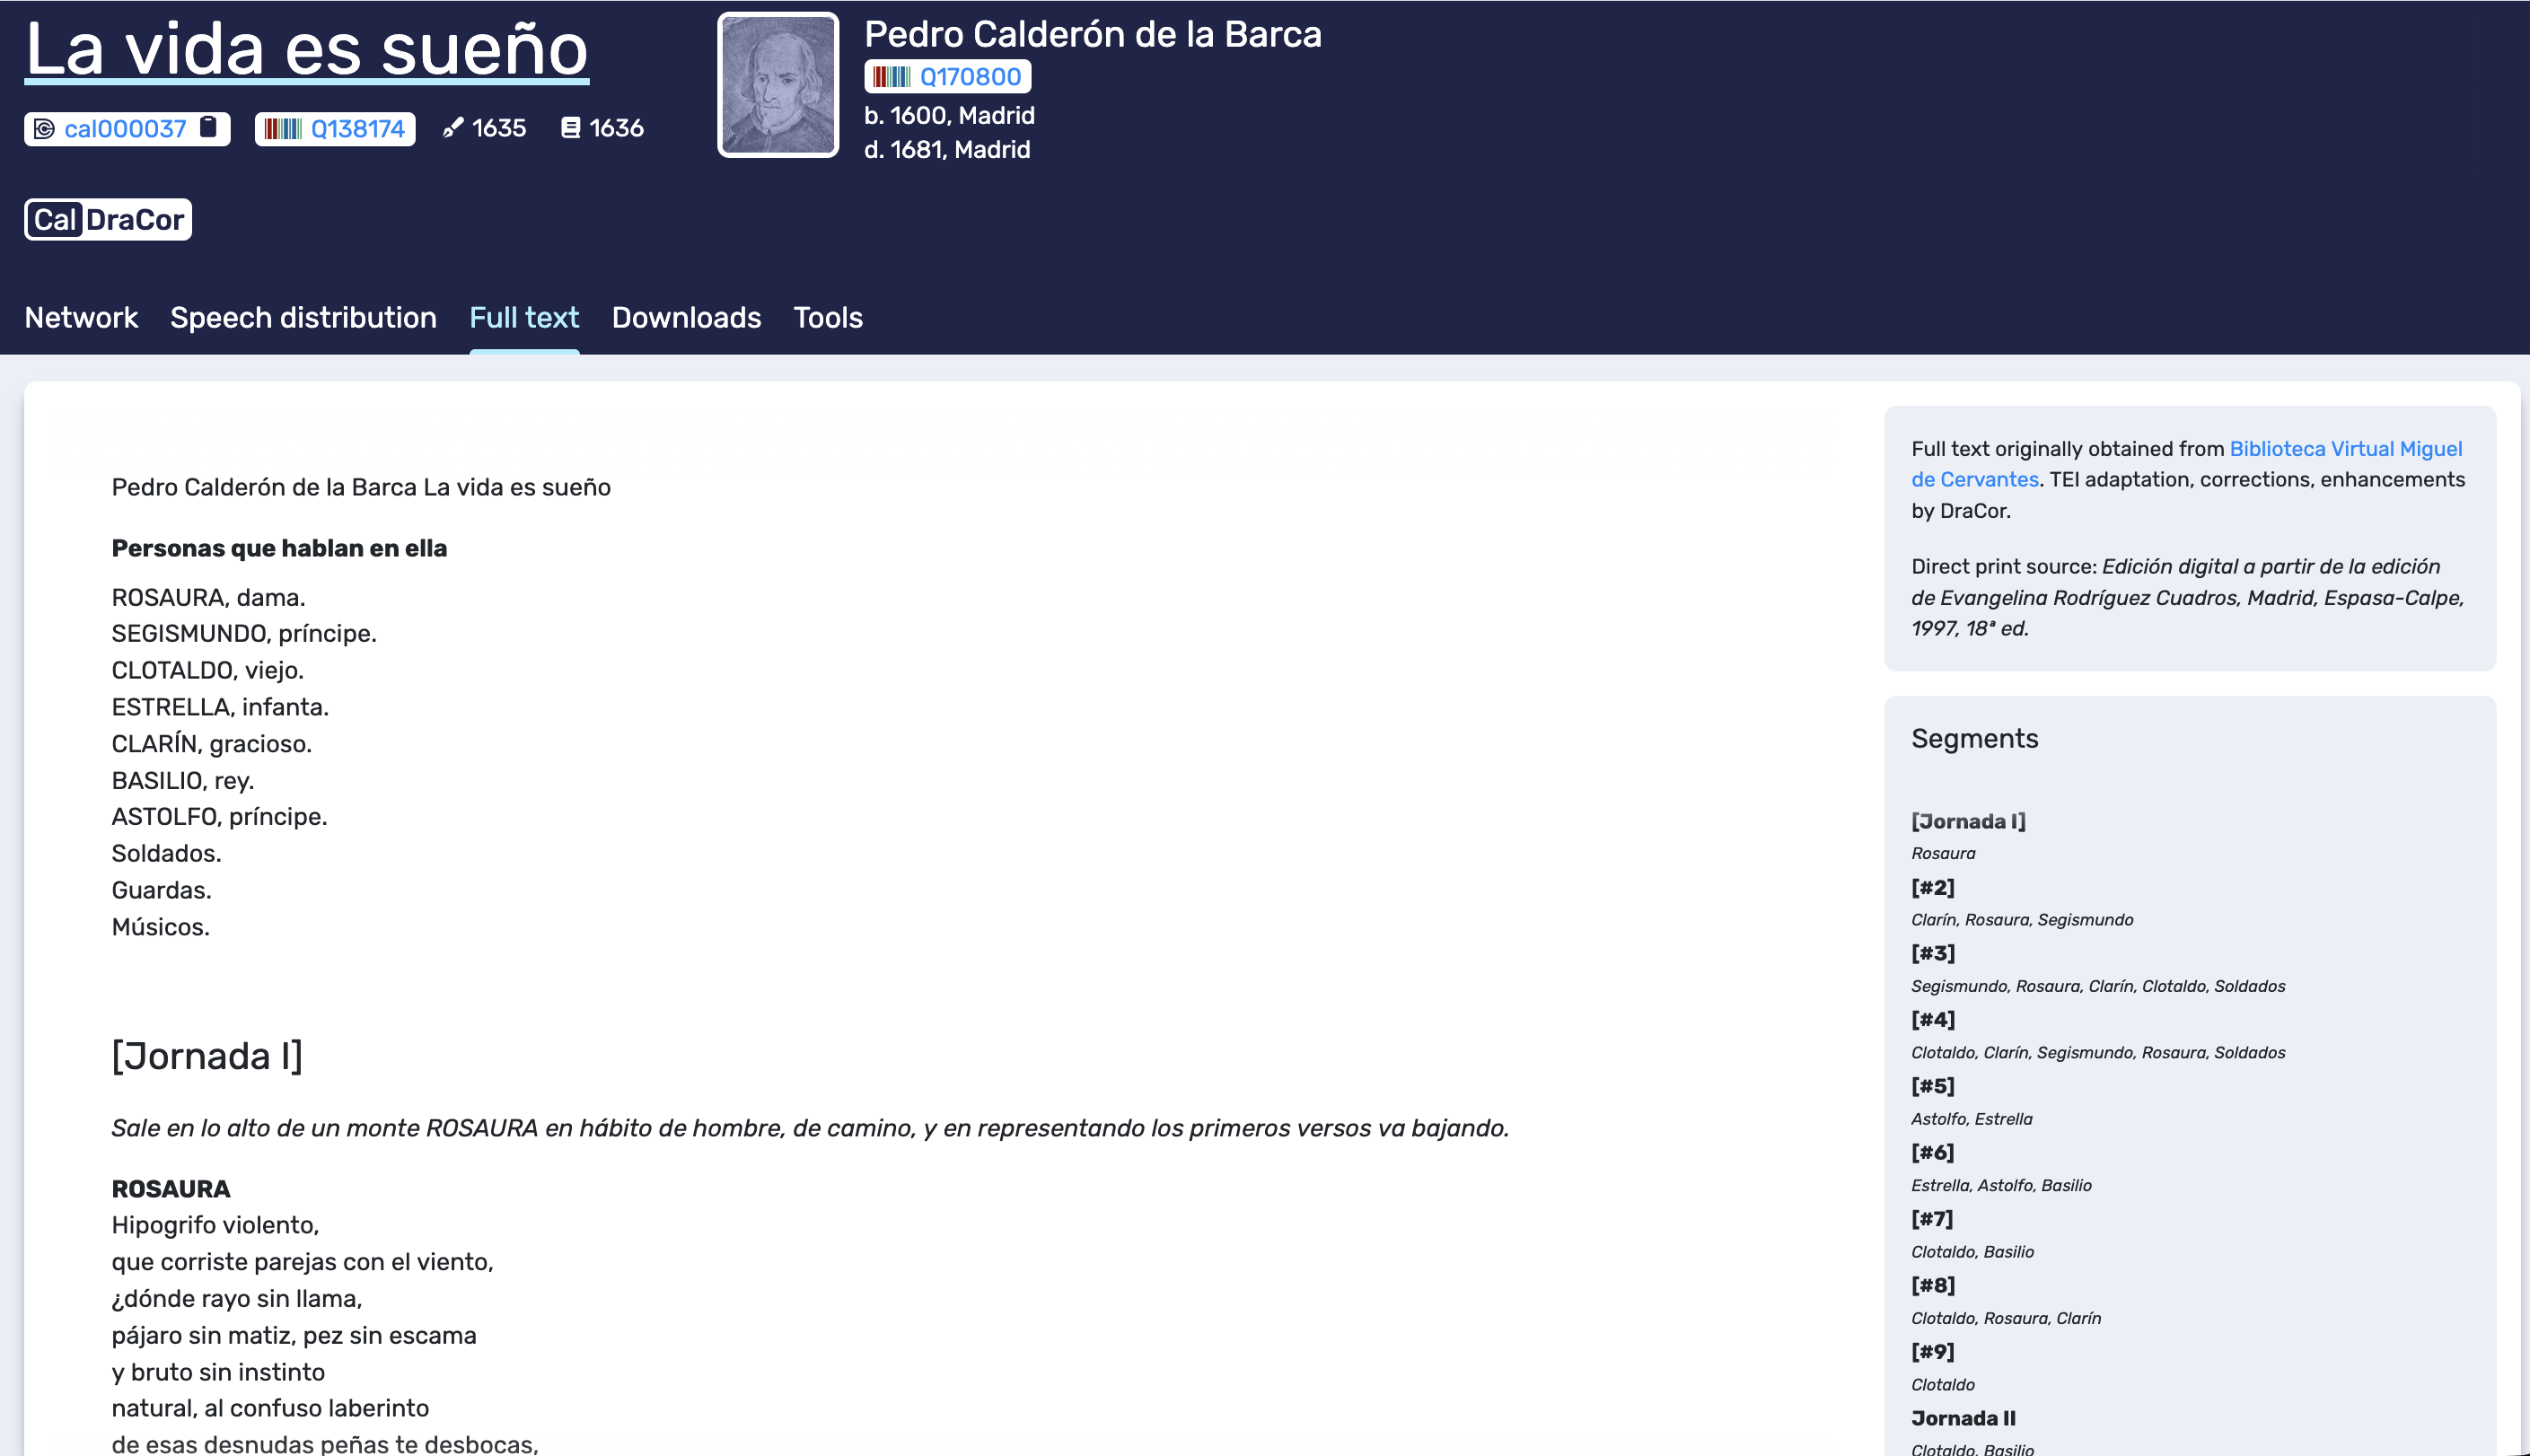
Full text tab. The play text is displayed with provenance notes and a segment list that supports navigation and clarifies the segmentation used in derived views.
Tab 4. Downloads#
The Downloads tab provides access to different semantic layers of a play in multiple formats. This is the transparency layer of the front-end: it allows us to retrieve artefacts that correspond to what we see in the interface. In the example, network data can be downloaded in common graph exchange formats (CSV, GEXF, GraphML). The tab also offers exports for spoken text (for example, JSON by character and plain TXT), stage directions (with and without speaker names), the character list (CSV/JSON, often including precalculated data), and the full TEI-encoded text.
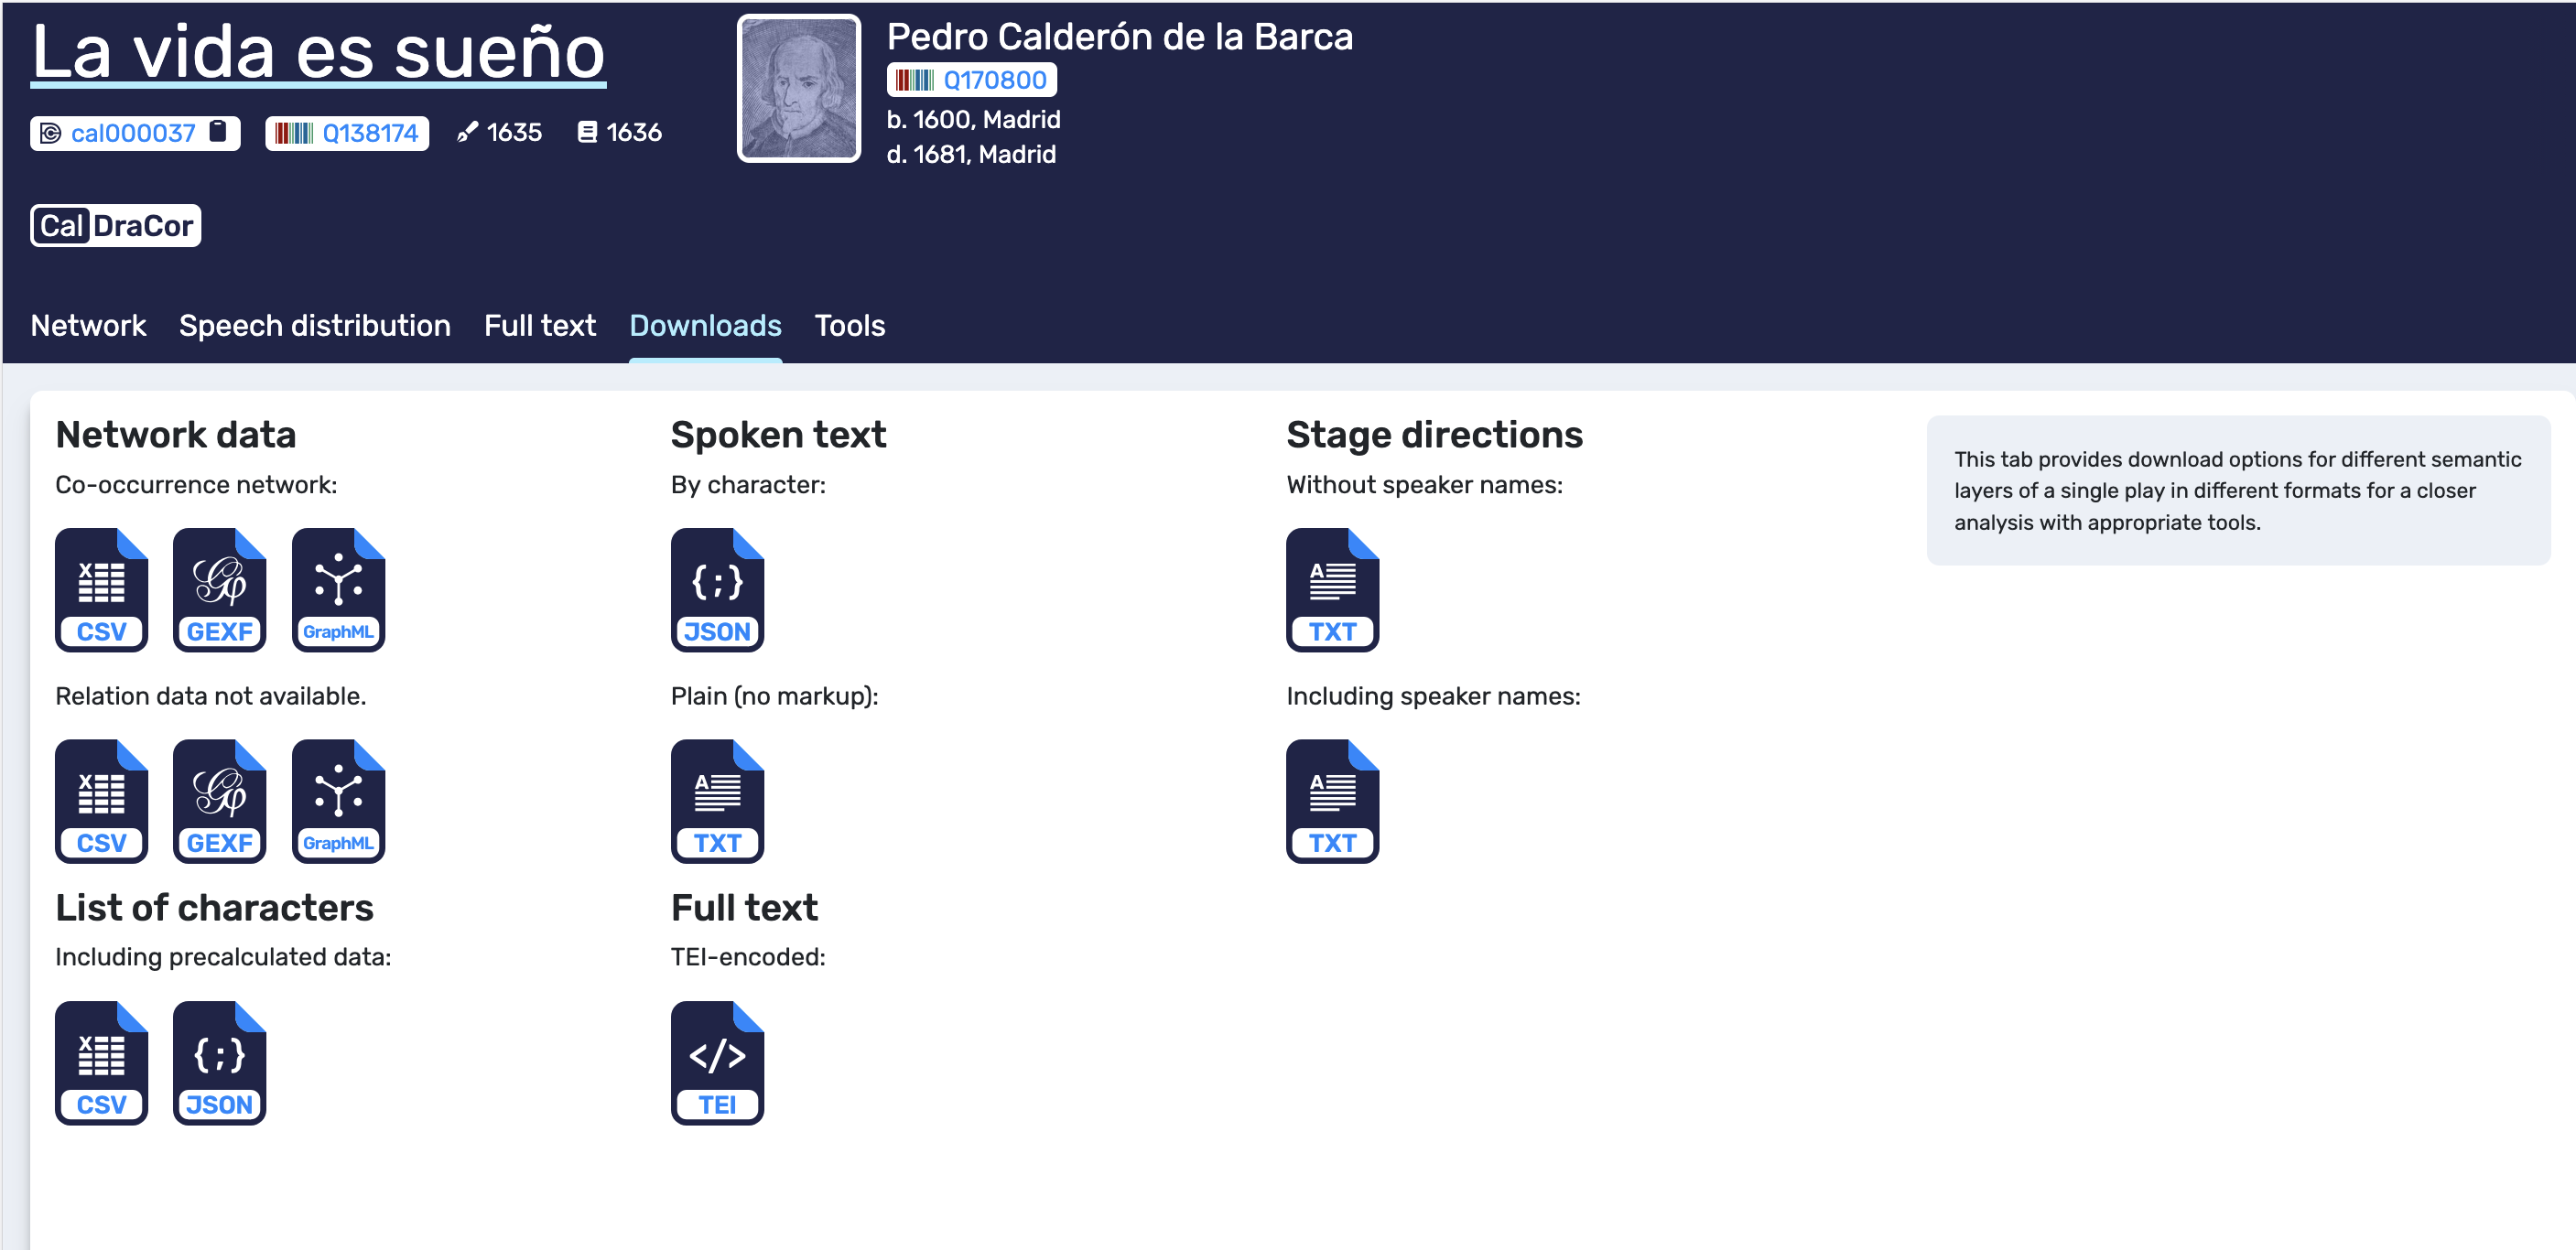
Downloads tab. DraCor provides exports for different semantic layers of a play (network data, spoken text, stage directions, character lists, and TEI full text) in multiple formats.
Tab 5. Tools#
The Tools tab links the play to external tools and lets us choose which textual layer should be routed to those tools. In the example, we can select the text layer for analysis (Full text in TEI, plain text, spoken text, or stage directions) and then open third-party services such as Voyant Tools or the CLARIN Language Resource Switchboard. The tab also includes an entry point for network analysis via Gephi Lite.
The main interpretive point here is that the selected layer shapes the results. Plain text and spoken text are typically more suitable for quick exploratory analyses in general-purpose tools, while TEI-encoded text is better reserved for workflows that are explicitly TEI-compliant. For transparent reporting, it is enough to note which layer was selected and which tool was used, so that the external output can be understood as a transformation of a specific DraCor layer rather than as an abstract result detached from its source.
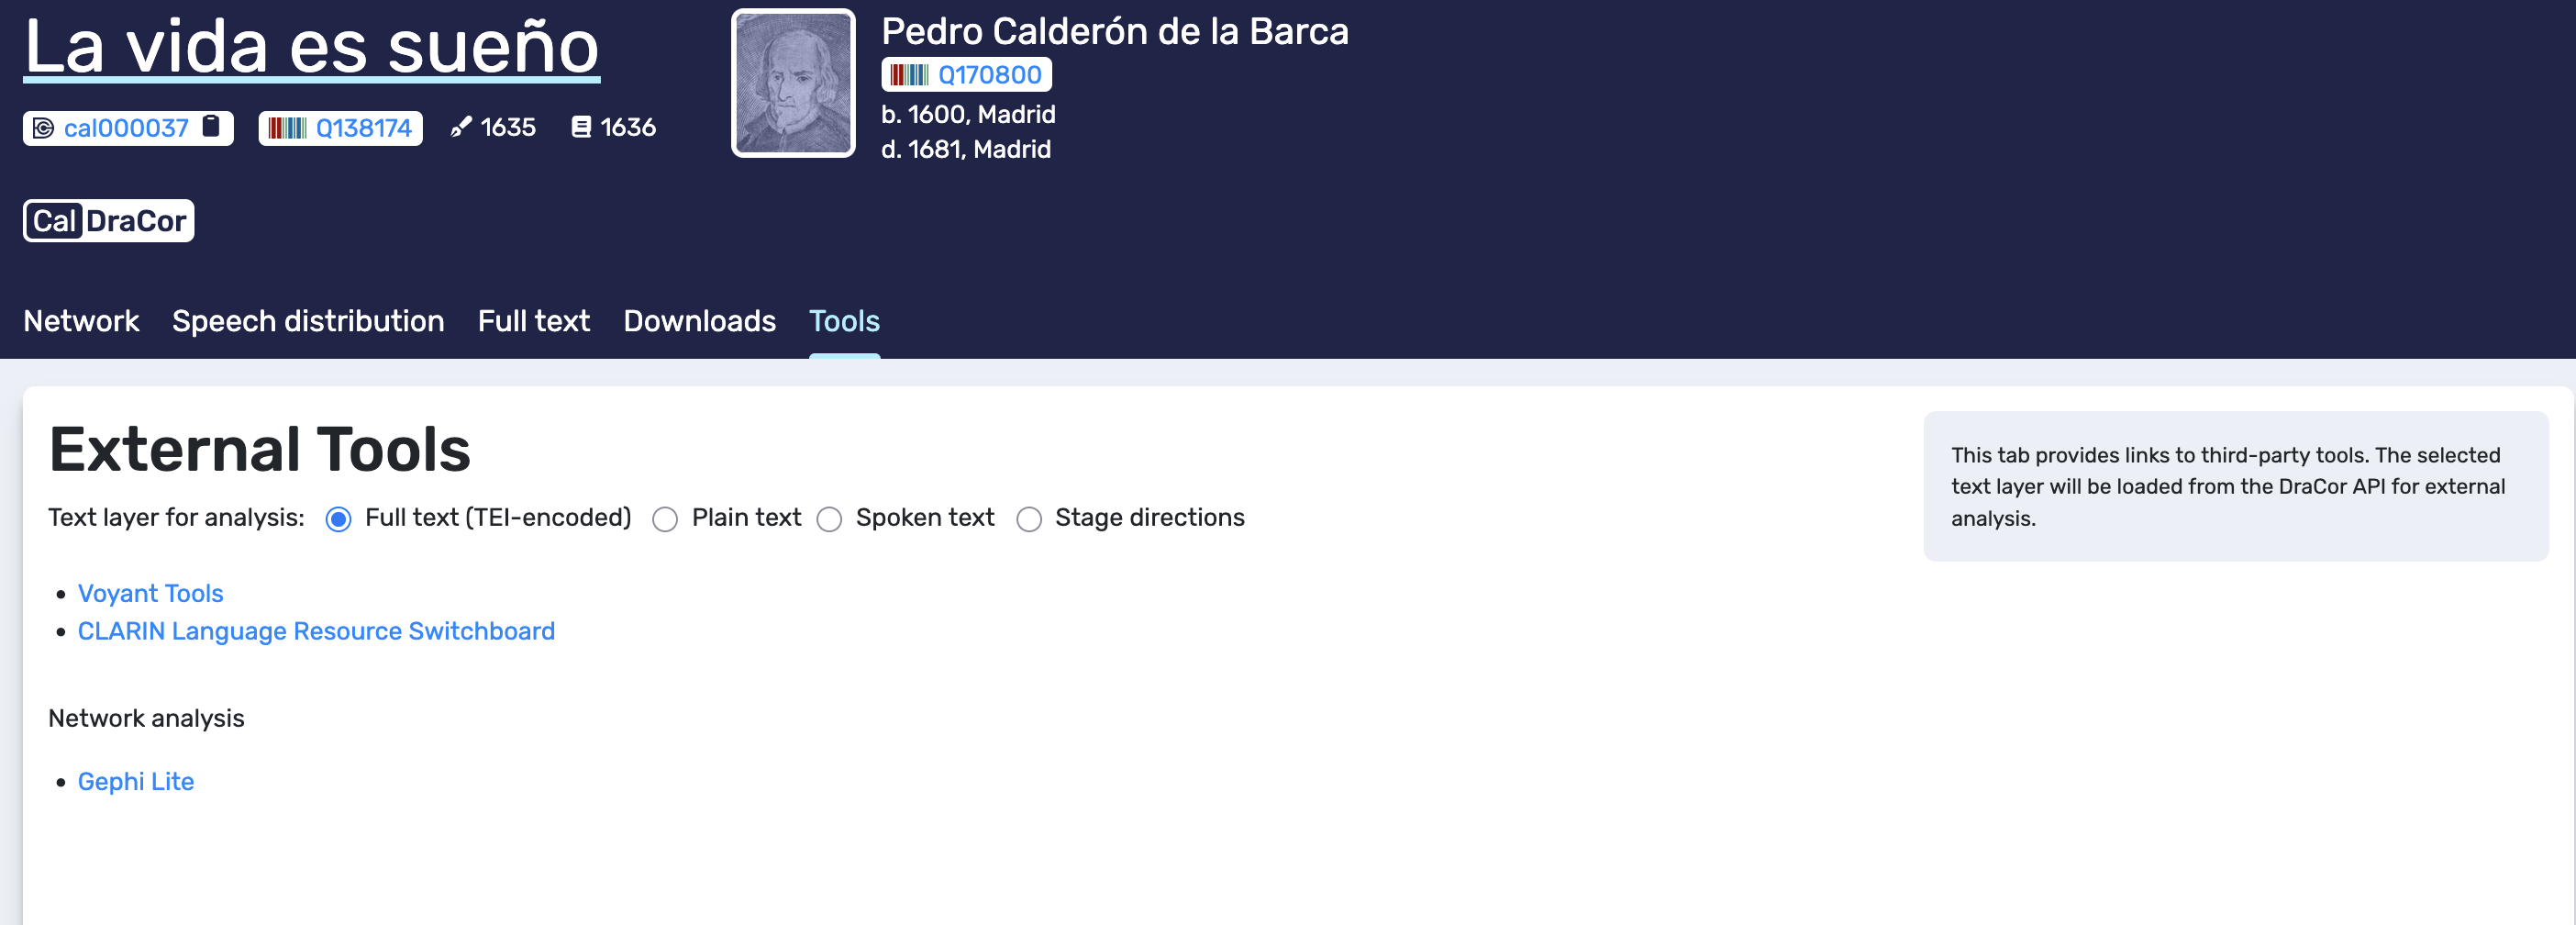
Tools tab. The interface offers links to external tools and lets us choose which text layer (TEI, plain, spoken, stage directions) is used for external analysis.
6. Exercises#
Exercise 1. Identify interface layers (10–15 minutes) Choose one play and write 2–3 sentences per tab explaining what kind of representation it provides (network, distribution, text, exports, external tools).
Self-check: are you describing what is shown, rather than what you think it “means”?
Exercise 2. Connect Network and Full text (15–20 minutes) Pick one character that appears highly connected in the Network tab. Use the Segments panel in Full text to locate two segments where this character appears with multiple others, and describe what is happening in those passages.
Self-check: can you point to specific segments or headings that support your observation?
Exercise 3. Transparency via Downloads (10–15 minutes) Download one file that corresponds to a view you used (for example, a network export). Note which semantic layer and which file format you chose, and why it matches your purpose.
Self-check: could someone else retrieve the same file and understand what it represents?
Self-test
Open the Self-test: Front-end.
7. Teaching Notes#
This chapter works well as a 60–90 minute practical session. A useful rhythm is a short guided tour (home page to corpus to play tabs), followed by paired work where learners document one play in a short “Record note” (corpus, play ID, tab, and a brief observation), and a closing discussion on how modelling assumptions (segmentation, inclusion of group characters, chosen method in speech distribution tab) shape what the interface visualises.
8. Further Reading and Resources#
To Do
9. Glossary#
Term |
Definition |
|---|---|
Front-end |
The user-facing web interface of DraCor. |
Play ID (slug) |
A stable identifier for a play (visible in the header/URL and in corpus tables). |
Segment |
A unit of segmentation used by the interface to structure co-occurrence and navigation. |
Co-occurrence network |
A network where characters are linked if they appear in the same unit (for example, a scene or act), as stated by the interface. |
Network size |
The number of speaking characters/entities in a play. |
Network diameter |
The highest value among all shortest distances between two nodes. |
Network density |
A value between 0 and 1 indicating how many of all possible connections between nodes are realised. |
Clustering coefficient |
A value between 0 and 1 determined by the ratio of possible “triangles” in a network to actually connected triplets. |
Average path length |
The average of all shortest path lengths between pairs of nodes in a connected network. |
Maximum degree |
The highest number of direct connections held by any single node (often shown with the character’s name). |
personGrp |
A group character (collective role) distinguished from individual persons. |
10. Next Steps#
Continue with: Chapter 4 (API) to understand how the front-end relates to programmatic access and reproducible workflows.
11. References#
Sapogov 1974
Yarkho 1997/2019
Trilcke/Fischer et al. 2017